- September 2, 2021
- Posted by: Saddle Point
- Category: Planning and Optimization, Supply Chain Digitization

Joanna was a bright, experienced MBA from Stanford. She had recently joined one of the largest F100 FMCG companies and was extremely excited to be part of the Digital Supply Chain Transformation Project that the company had recently embarked on.
As part of her new assignment, she was responsible for reducing the working capital held up in inventory, reduction in product obsolescence and reduction in warehousing cost. All these, as she rightly realized, were all linked to the inventory that the supply chain was carrying.
To deliver on her KPIs, she had to figure out ways to rationalize the inventory and, in her opinion, Brad was the best person to help her with this.
Brad was an experienced consultant who had helped many companies digitize their supply chains. He was instrumental in delivering huge transformative projects and was well respected in the organization.
Meanwhile, Joanna being fiercely independent, had gone ahead and downloaded a Safety Stock Calculation Template. She took some time to punch in the required numbers. Once she was ready, she scheduled a meeting with Brad to validate her findings.
Brad looked at the calculations and asked Joanna to plot the graph of historical data and safety stock. Then he pointed out the products that had distinctive patterns in their sales data. These patterns, he explained would be captured by a forecasting software and would then be used to forecast the future. Brad then went on to explain the fundamental reasons for carrying safety stock. He explained that Safety Stock are carried to tide over the gap between what was forecasted verses what the customer actually bought. In absence of a Safety Stock, a higher sale compared to the forecast resulted in a stock out. Technically, if we can forecast the demand correctly, then there would be no need to carry any safety stock.
Brad pulled out the data from one of his assignments and showed the Historical sales and the forecast pattern to Joanna.
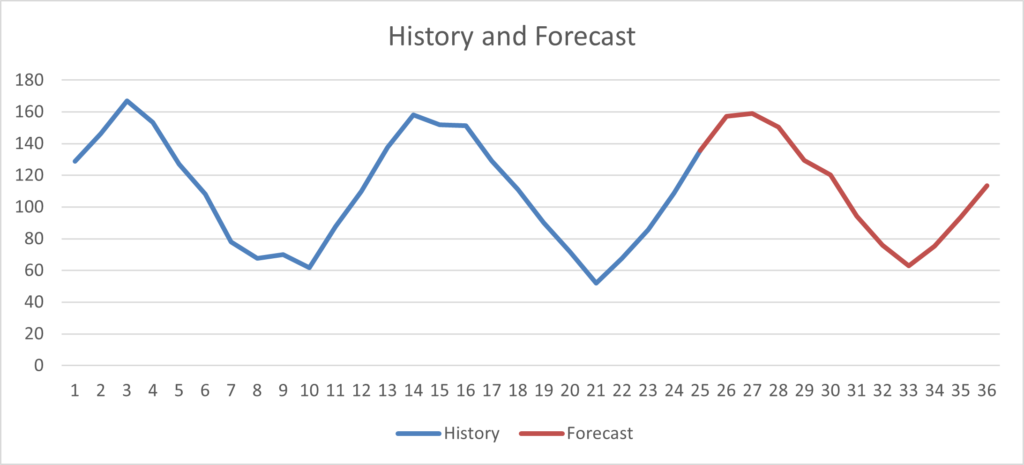
Brad explained that this product showed a seasonal behavior and had a good pattern in the historical sales. The same pattern can be easily identified by a good forecasting engine. There will be some forecasting errors for which safety stock should be kept. However, if we calculate the deviation across the historical data, as Joanna had calculated, then the deviation will be huge compared to the actual deviation. This will unnecessarily prompt a higher inventory level. Joanna quickly calculated both the numbers and found that the deviation calculated across historical periods was around 5 times of the actual deviation. This faulty calculation technique, as she correctly guessed, was the reason for inflated inventory numbers for the seasonal products.
Armed with this knowledge, Joanna recalculated the inventory numbers and right sized the inventory. For some products, the inventory went up and for many it went down. Even with a higher service level, she could still reduce the total inventory by more than 26%.
Joanna was very happy with what she had found and pulled a reluctant Brad to the nearest pub for a pint of wheat beer.