- August 8, 2020
- Posted by: Saddle Point
- Category: Planning and Optimization, Supply Chain Analytics, Supply Chain Digitization

Steve loved reading. He loved books. During the early days of the internet, when e-books were downloadable free, it was like manna from heaven for Steve. He would spend sleepless nights crawling the internet in search of his beloved books. After spending countless nights like this he realized that he was just hoarding. In the last few months he had not even read a single book but had wasted countless ones looking for those.
Our day to day lives are not very different when it comes to analytics. Let’s admit it. We all love dashboards. We fantasize about unearthing many nuggets of business wisdom by doing slicing dicing of these dashboards that have countless combinations and therefore end up developing hundreds of dashboards and scores of reports. We develop KPI’s and dashboards for every scenario possible and then conveniently forget why in the first place those were developed. Over time, this issue gets compounded as new KPIs get added but none of the old ones are removed.
 The MIS team and end users spend countless numbers of hours in playing with spreadsheets, putting filters and moving things across rows and columns to generate these fancy dashboards and by the time the reports and KPIs are generated, the data would have become stale and it’s time for new dashboards.
Even-though, at a strategic level, this type of deep analysis makes sense, our normal lives don’t offer us the luxury of time or the mental capability to do this extensive analysis. Finally we end up cluttering our analysis with many corner-case KPIs and Reports. This approach of analytics creates an issue of de-focusing. Since everything is important, effectively nothing is important.
Everything is simple as long as things are simplified. The 2×2 matrix of Steve Jobs approach to product portfolio management is well known. With a single stroke, the entire product portfolio clutter was thrown out of the window and was replaced with a neat 2×2 portfolio.
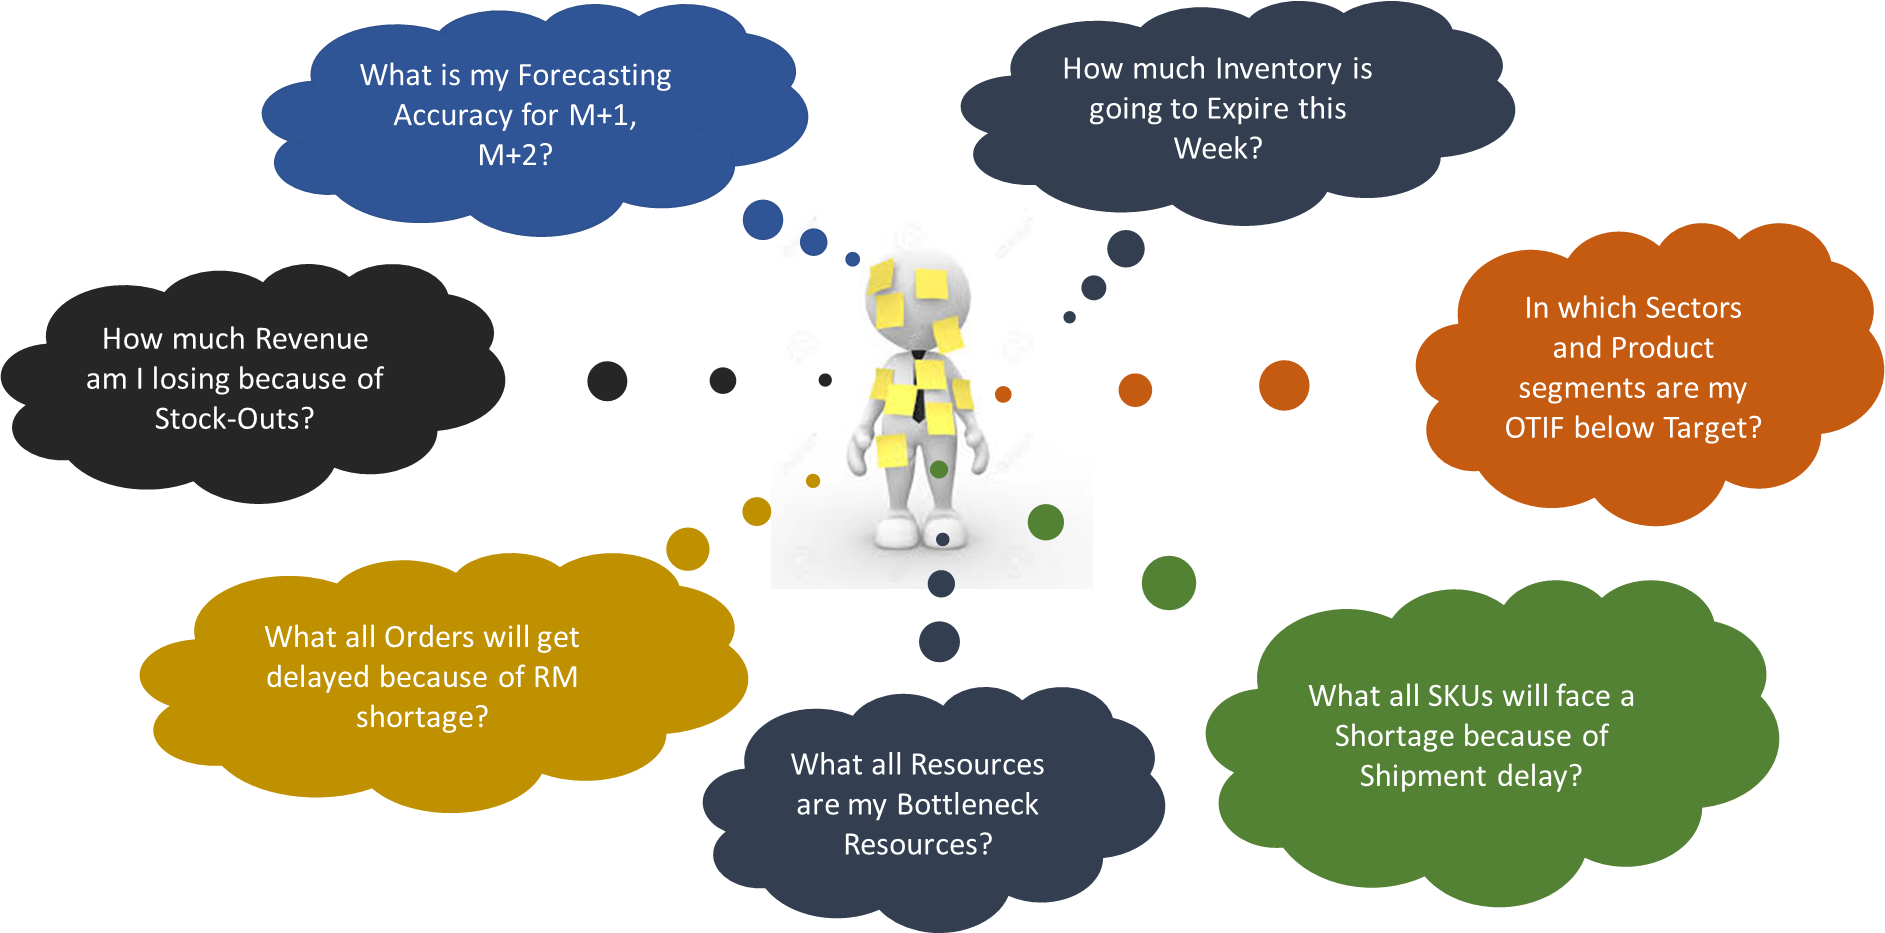
In Supply chain, each key process is driven by a few key KPIs. Once those are tracked and brought under control, things start to move smoothly. A second level of KPIs that transcends multiple processes are also desirable as those capture the dependencies across processes and show the efficiency and effectiveness of the supply chain.
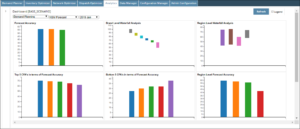 It is therefore very important to have a single integrated and automated system that enables planning of all supply chain processes and then it enables the user to track and monitor the major KPIs across those processes. This not only saves the MIS team countless of mind numbing hours in generating these reports but also make these numbers correct and instantaneous thereby speeding up the decision making process.